Reviewsnap - Performance History Report
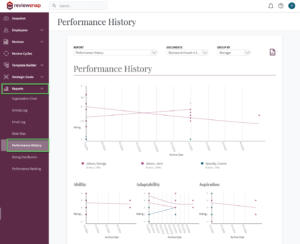
Step One: Log in as Admin or Manager. Using the Reports tab on the Navigation Bar, click Performance History.
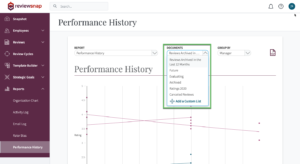
Step Two: Under Documents, select the list of data you wish to view.
NOTE: Create a New Custom List if you wish to view a data set of document based on specific criteria beyond the default set of choices.
NOTE: Performance history may have dots that connect and it may have many scattered dots. It’s good to make them connect in order to see a trend line. In order to do this, you may need to shorten the length of time from many years of data to fewer years of data in order to create trend lines.
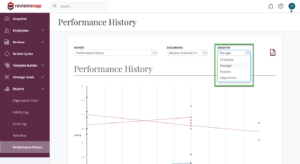
Step Three: Refine the data set by selecting the group of documents you wish to view from the Group By list.
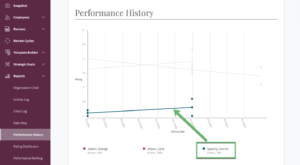
Step Four: Hover on a trend line to reveal the specifics of performance over time. Hovering on a specific dot shows the Review data for a particular Review. From here, you can click View Review to view the scoring data.
Each dot on the line represents a unique performance Review.
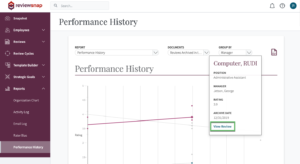
Step Five: Hover on a name (as show in this example) or a department, location, etc. to reveal the specifics for that data set. There will be a trend line on the graph.
Step Six: The reports gets even more granular below. Here, when clicking on employee Cosmo Spacely, the graphs below show the ratings that Cosmo has received on each Review that comprises the data set.
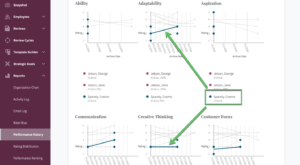
Step Seven: Some competencies may not contain data, depending on the data set selected.
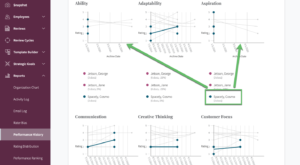
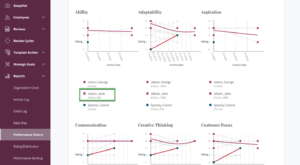
Step Eight: Hover on an employee, (in this example) or a department, location, etc. to reveal the specific competency trends if desired.
You can also call us at 1 (800) 516-5849